This post shows the steps I used to install Prometheus and its Node Exporter to show “server” statistics on my Grafana BI application. All running on my Raspberry Pi.
This will give me real-time resource monitoring (CPU, memory, disk, filesystem, network interface) with Grafana dashboards—all running locally.
Overview:
- Download, install and configure the Node Exporter (the systems metrics collector)
- Download, install and configure Prometheus (the server program binary)
Step 1: Install and Configure Node Exporter (Resource Collector)
Download & Install
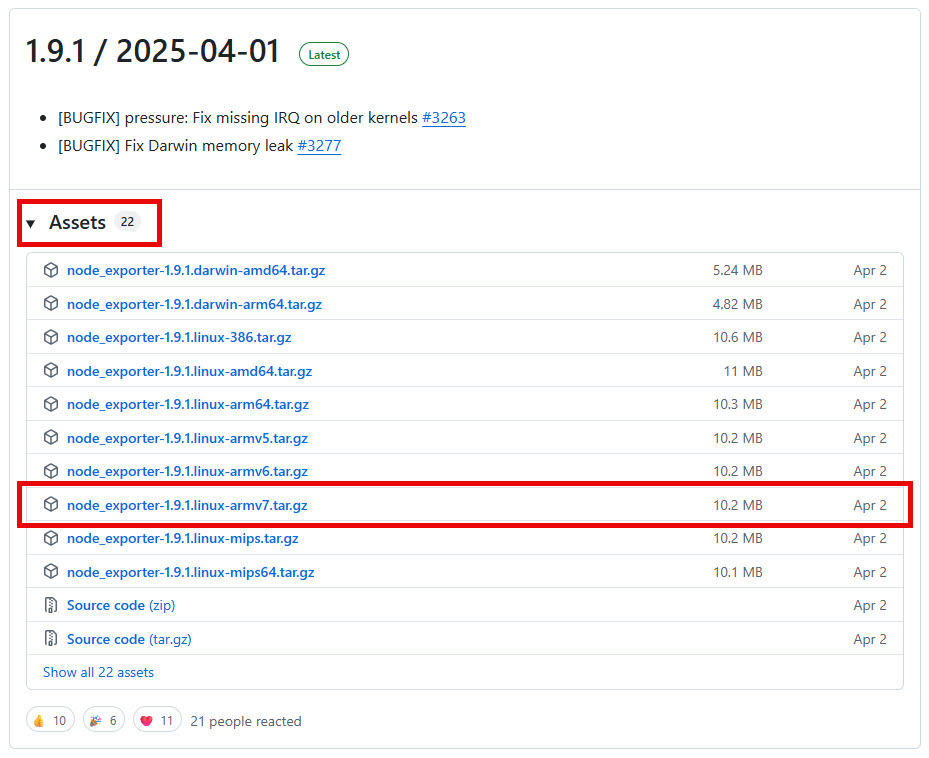
- Get latest Node Exporter from GitHub.
- Here: https://github.com/prometheus/node_exporter/releases
- Check Releases page (Expand the Assets tab)
- Look for latest version. Raspberry Pi Linux (ARM architecture)
- i.e. “node_exporter-1.9.1.linux-armv7.tar.gz“
- Insert the URL into the
wgetcommand below
Image…
$ wget https://github.com/prometheus/node_exporter/releases/download/v1.9.1/node_exporter-1.9.1.linux-armv7.tar.gz

$ tar xzf node_exporter-*.tar.gz

$ sudo mv node_exporter-*/node_exporter /usr/local/bin/
Create Systemd Service
$ sudo useradd -rs /bin/false nodeusrCreate and add configuration to the /etc/systemd/system/node_exporter.service
$ sudo vim /etc/systemd/system/node_exporter.serviceEnter:
[Unit]
Description=Prometheus Node Exporter
After=network.target

[Service]
User=nodeusr
ExecStart=/usr/local/bin/node_exporter

[Install]
WantedBy=default.target
Ensure correct ownership and permissions
$ sudo chown root:root /etc/systemd/system/node_exporter.service

$ sudo chmod 644 /etc/systemd/system/node_exporter.service
Enable & Start Deamons
The below steps reload the systemd (initialisation) manager configuration as we created the node_exporter.service file.
The “enable” switch creates a symbolic link in the /etc/systemd/system/multi-user.target.wants/ directory so the service starts at all future reboots and --now starts the service immediately.
$ sudo systemctl daemon-reload

$ sudo systemctl enable --now node_exporter
Step 2: Install Prometheus (Time-Series Collector Layer)
Download & Install
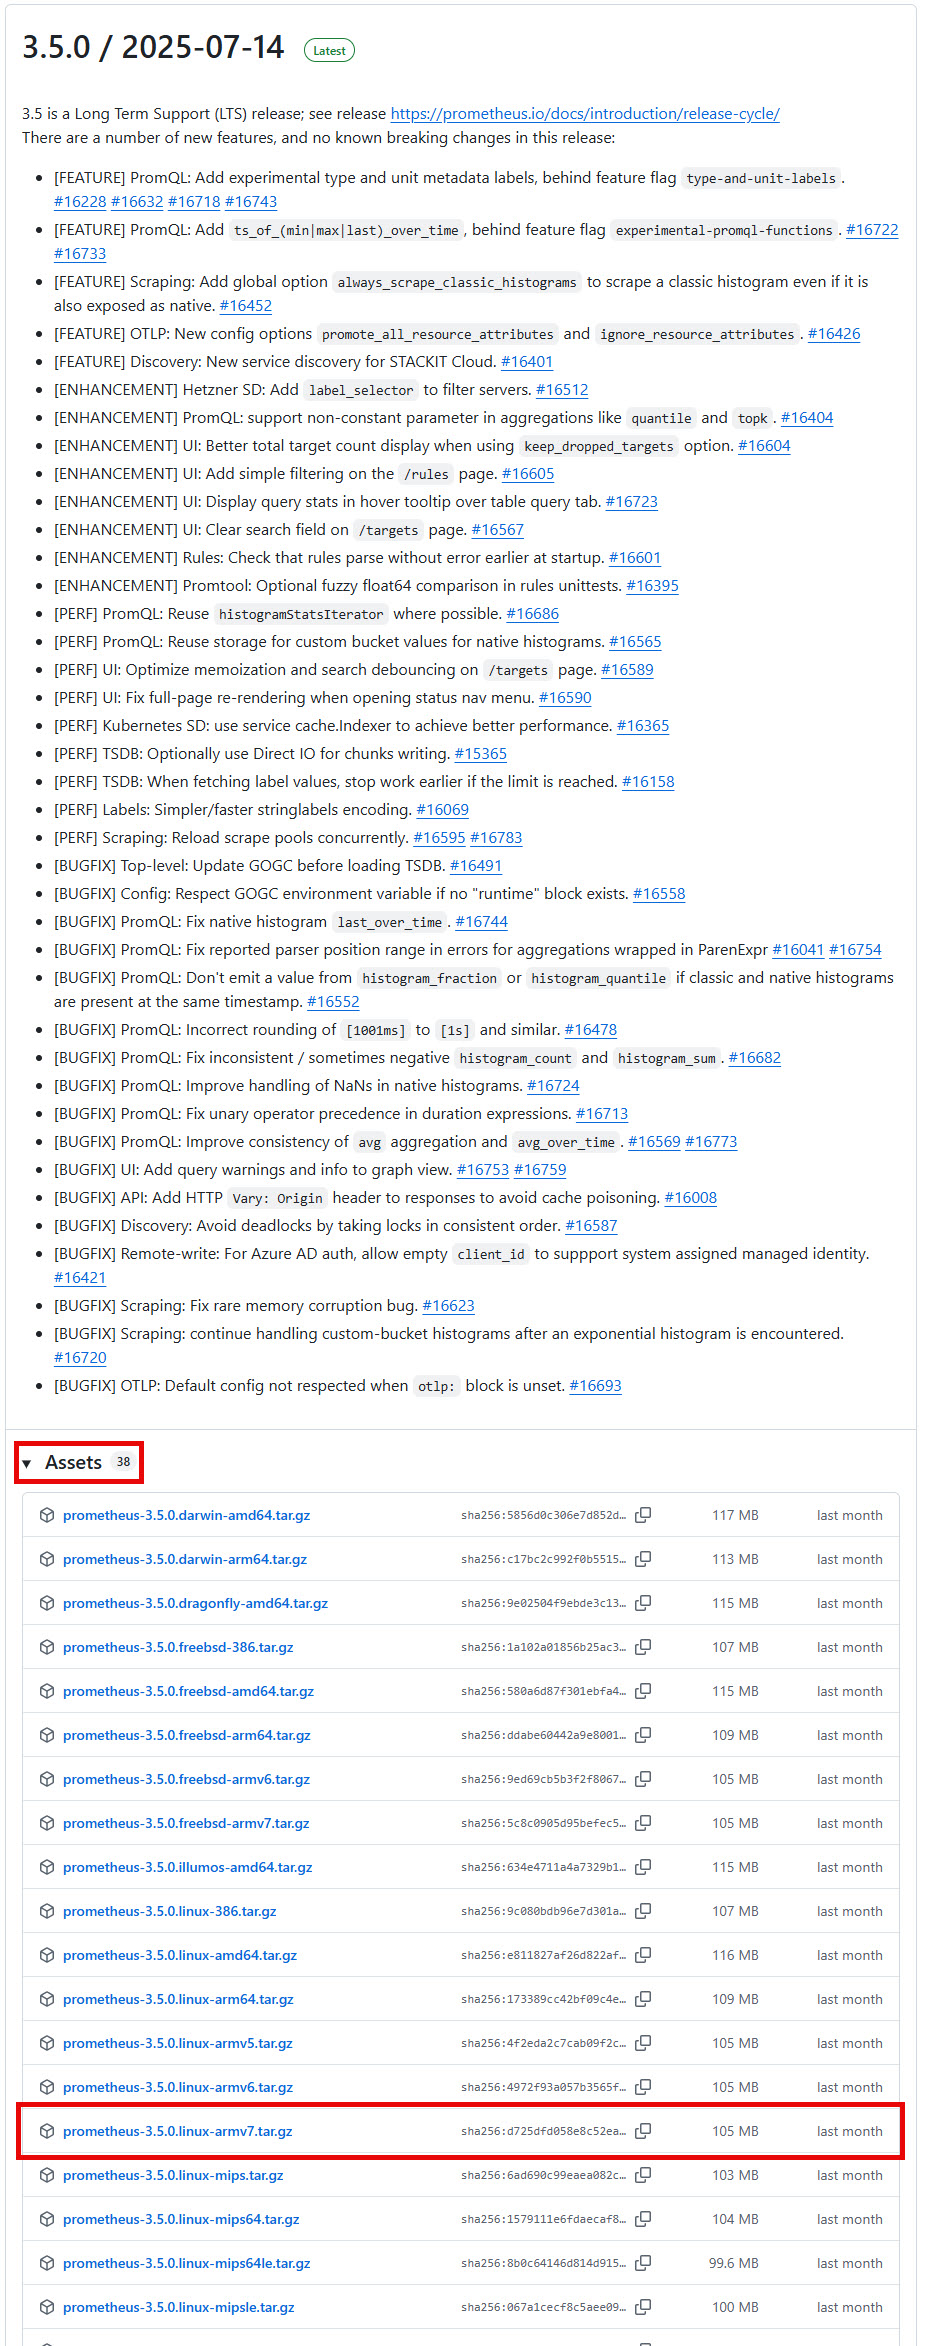
- Get latest Prometheus from GitHub.
- Here: https://github.com/prometheus/prometheus/releases
- Check Releases page (Expand the Assets tab)
- Look for latest version. Raspberry Pi Linux (ARM architecture)
- i.e. “https://github.com/prometheus/prometheus/releases/download/v3.5.0/prometheus-3.5.0.linux-armv7.tar.gz“
- Insert the URL into the
wgetcommand below
Image…
wget https://github.com/prometheus/prometheus/releases/download/v3.5.0/prometheus-3.5.0.linux-armv7.tar.gz

$ tar xzf prometheus-*.tar.gz

$ cd prometheus-3.5.0.linux-armv7/

$ sudo mv prometheus promtool /usr/local/bin/

$ sudo mkdir -p /etc/prometheus

$ sudo cp prometheus.yml /etc/prometheus/
Set ownerships and permissions
$ sudo chown -R root:root /etc/prometheus

$ sudo chmod -R 755 /etc/prometheus
Create Prometheus Config
Create and edit the /etc/prometheus/prometheus.yml file with the below configurations:
$ sudo vim /etc/prometheus/prometheus.ymlAppend the below text in order to scrape the Node Exporter on localhost:9100
scrape_configs:
  - job_name: 'node'
    static_configs:
      - targets: ['localhost:9100']
Create Systemd Service for Prometheus
Create /etc/systemd/system/prometheus.service:
$ sudo vim /etc/systemd/system/prometheus.serviceEnter:
[Unit]
Description=Prometheus Monitoring
After=network.target

[Service]
User=root
ExecStart=/usr/local/bin/prometheus \
  --config.file=/etc/prometheus/prometheus.yml \
  --storage.tsdb.path=/var/lib/prometheus \
  --web.listen-address=:9090 \
  --storage.tsdb.retention.time=15d

[Install]
WantedBy=default.target
Enable & Start
This step creates the /var/lib/prometheus data directory where Prometheus stores its TSDB (time-series database).
Similar to above, this step reloads the systemd (initialisation) file called /etc/systemd/system/prometheus.service .The service will also start at all future reboots and --now starts the service prometheus immediately.
$ sudo mkdir -p /var/lib/prometheus

$ sudo systemctl daemon-reload

$ sudo systemctl enable --now prometheus
Step 3: Install Grafana (Dashboard Layer)
This process:
- installs
apt-transport-httpsfor downloading over HTTPS instead of just HTTP - installs
software-properties-commonfor flexible management of repository sources - creates a secure directory for storing GPG keys used to verify package signatures
- installs BI tool Grafana
Install via APT (Advanced Package Tool)
$ sudo apt update

$ sudo apt install -y apt-transport-https software-properties-common

$ sudo mkdir -p /etc/apt/keyrings

$ wget -q -O - https://apt.grafana.com/gpg.key | sudo tee /etc/apt/keyrings/grafana.key > /dev/null

$ echo "deb [signed-by=/etc/apt/keyrings/grafana.key] https://apt.grafana.com stable main" | sudo tee /etc/apt/sources.list.d/grafana.list

$ sudo apt update

$ sudo apt install grafana
Enable & Start (grafana-server)
$ sudo systemctl enable --now grafana-serverStep 4: Configure Grafana to Use Prometheus
- In your internet browser open Grafana:
http://<localhost>:3000and login with defaults- Login:
admin - Password:
admin
- Login:
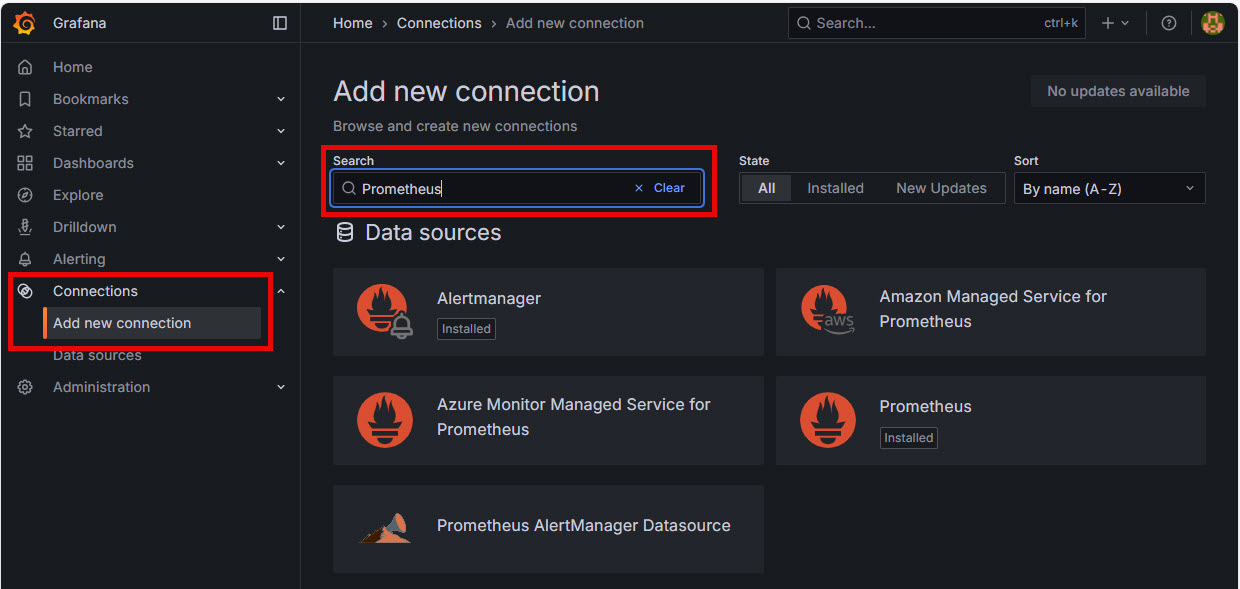
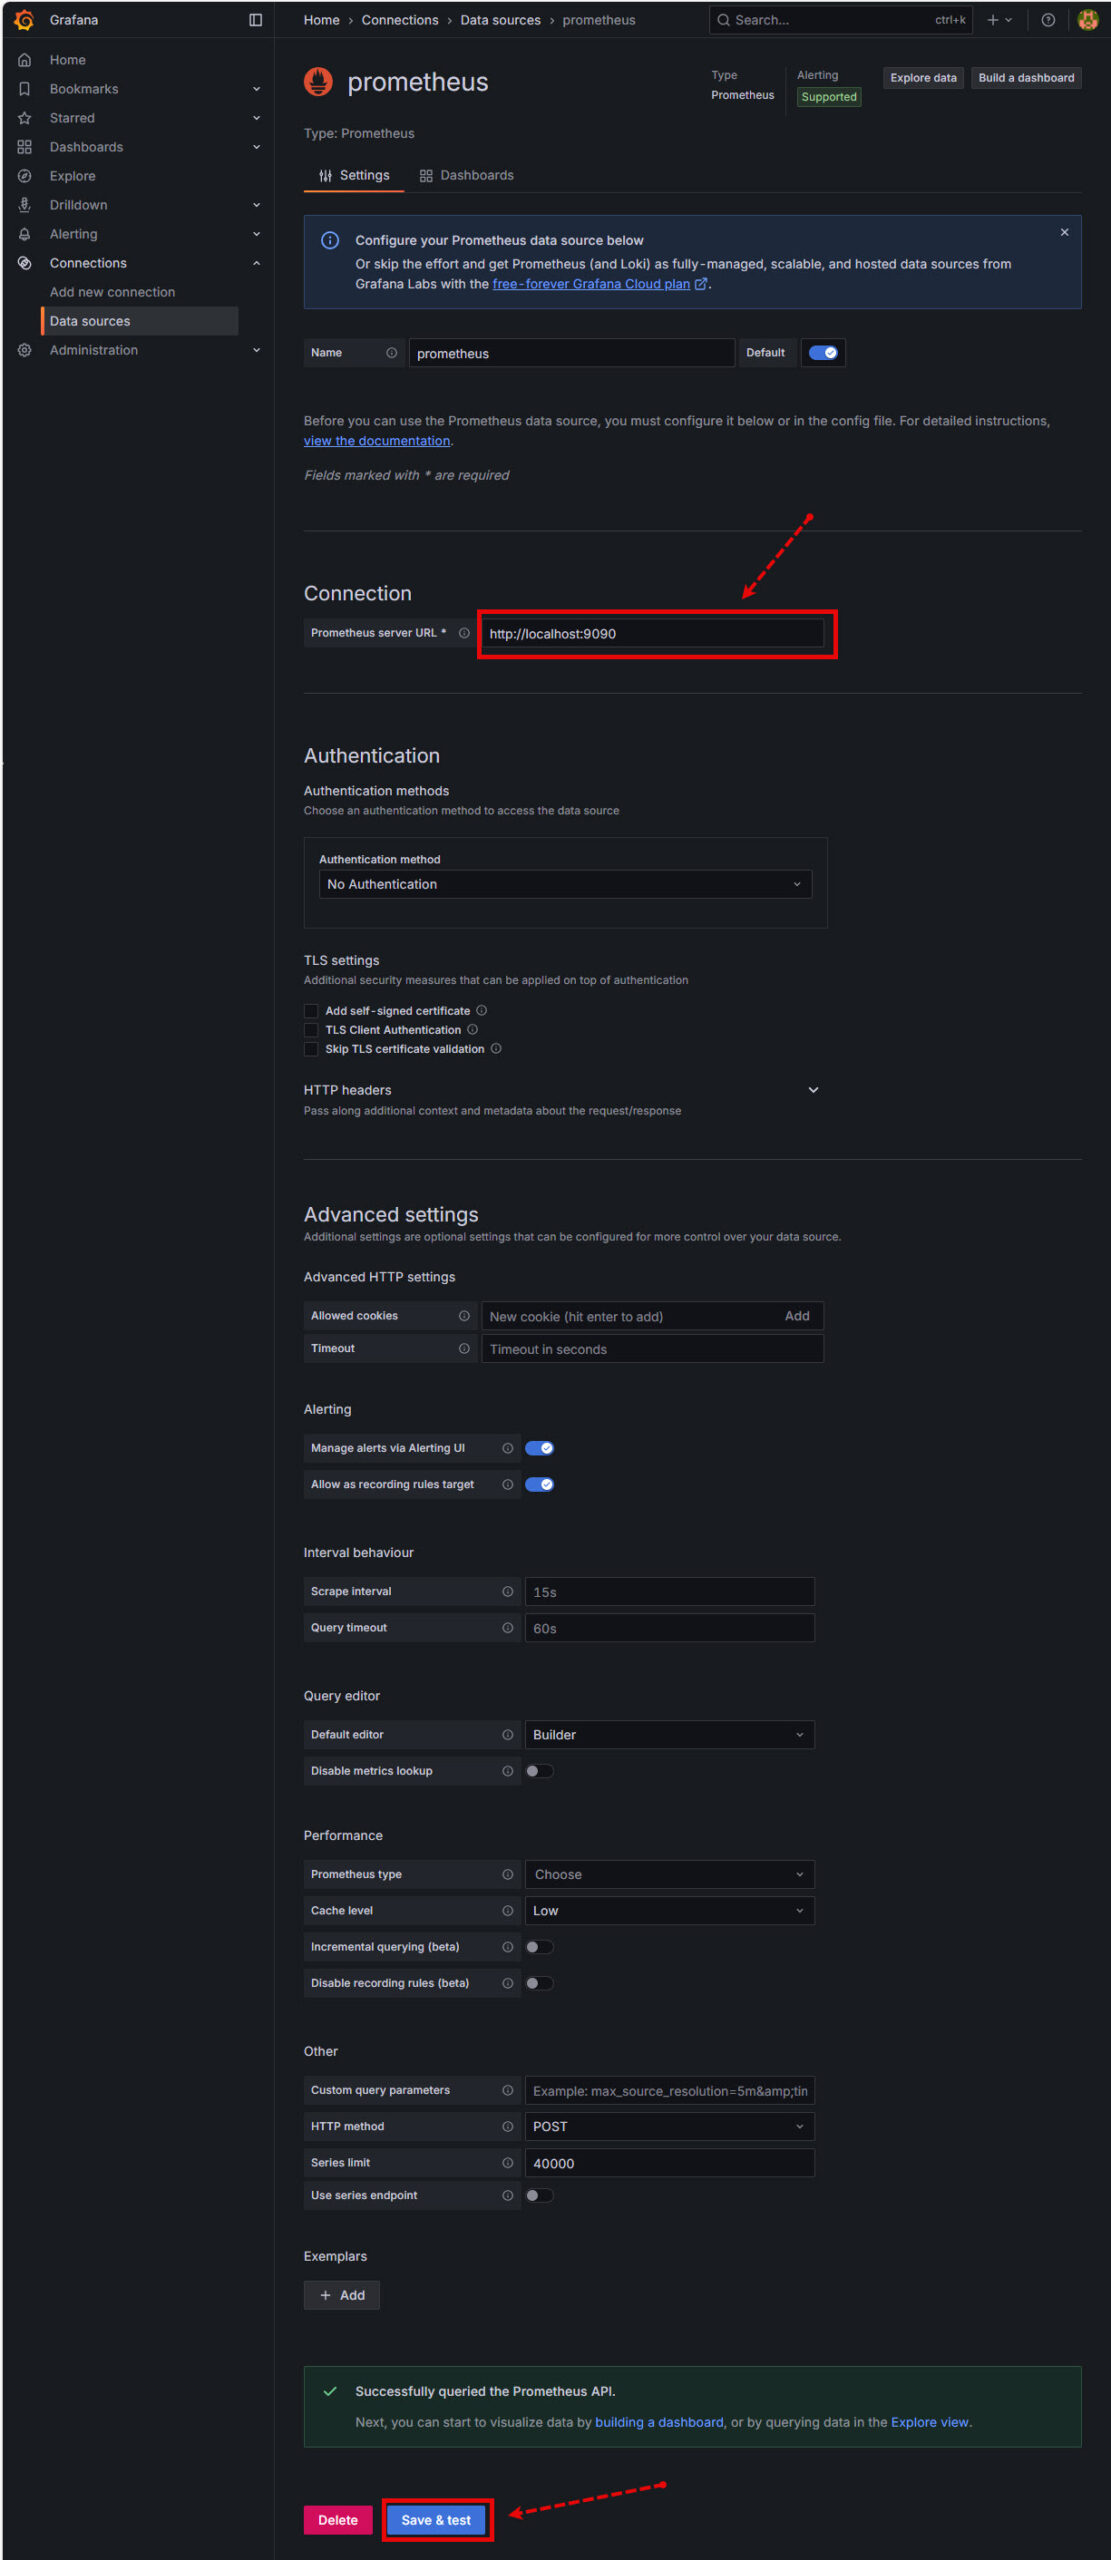
- Go to Connections → Add new connection
- Search and choose Prometheus
- Set URL to:
http://localhost:9090 - Then click Save & Test
Image…
Step 1
Step 2
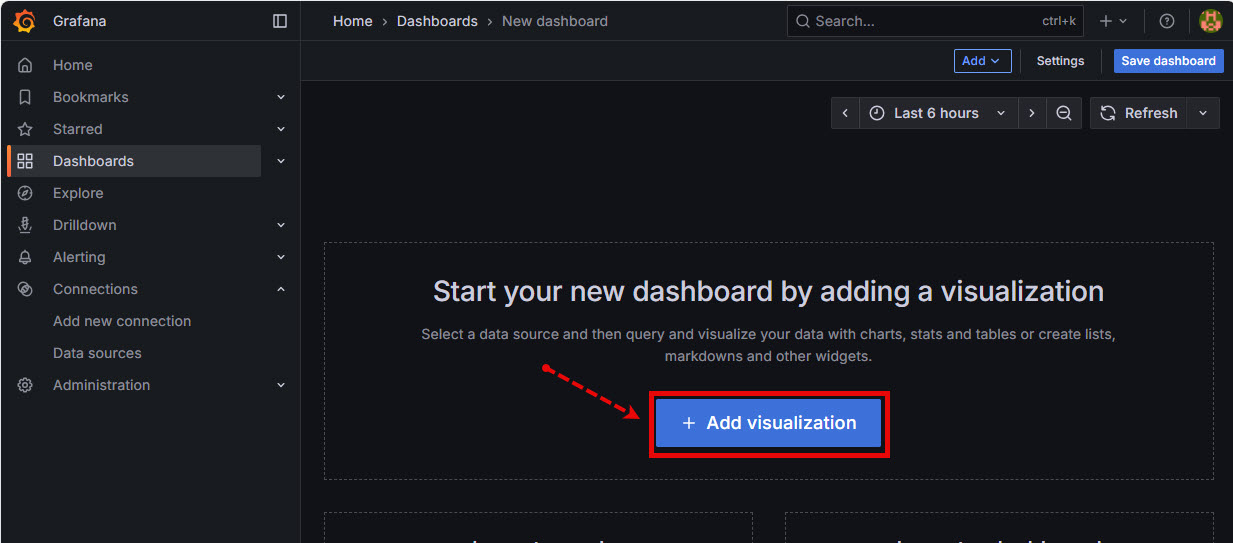
Step 5: Create Dashboards
In the Grafana GUI click on Dashboards -> New -> New Dashboard
Image…
![]()
The Grafana dashboard page will appear. Click on the Add visualization button
Image…
THe Select Data Source dialog box will appear. Click on promethius.
Image…
![]()
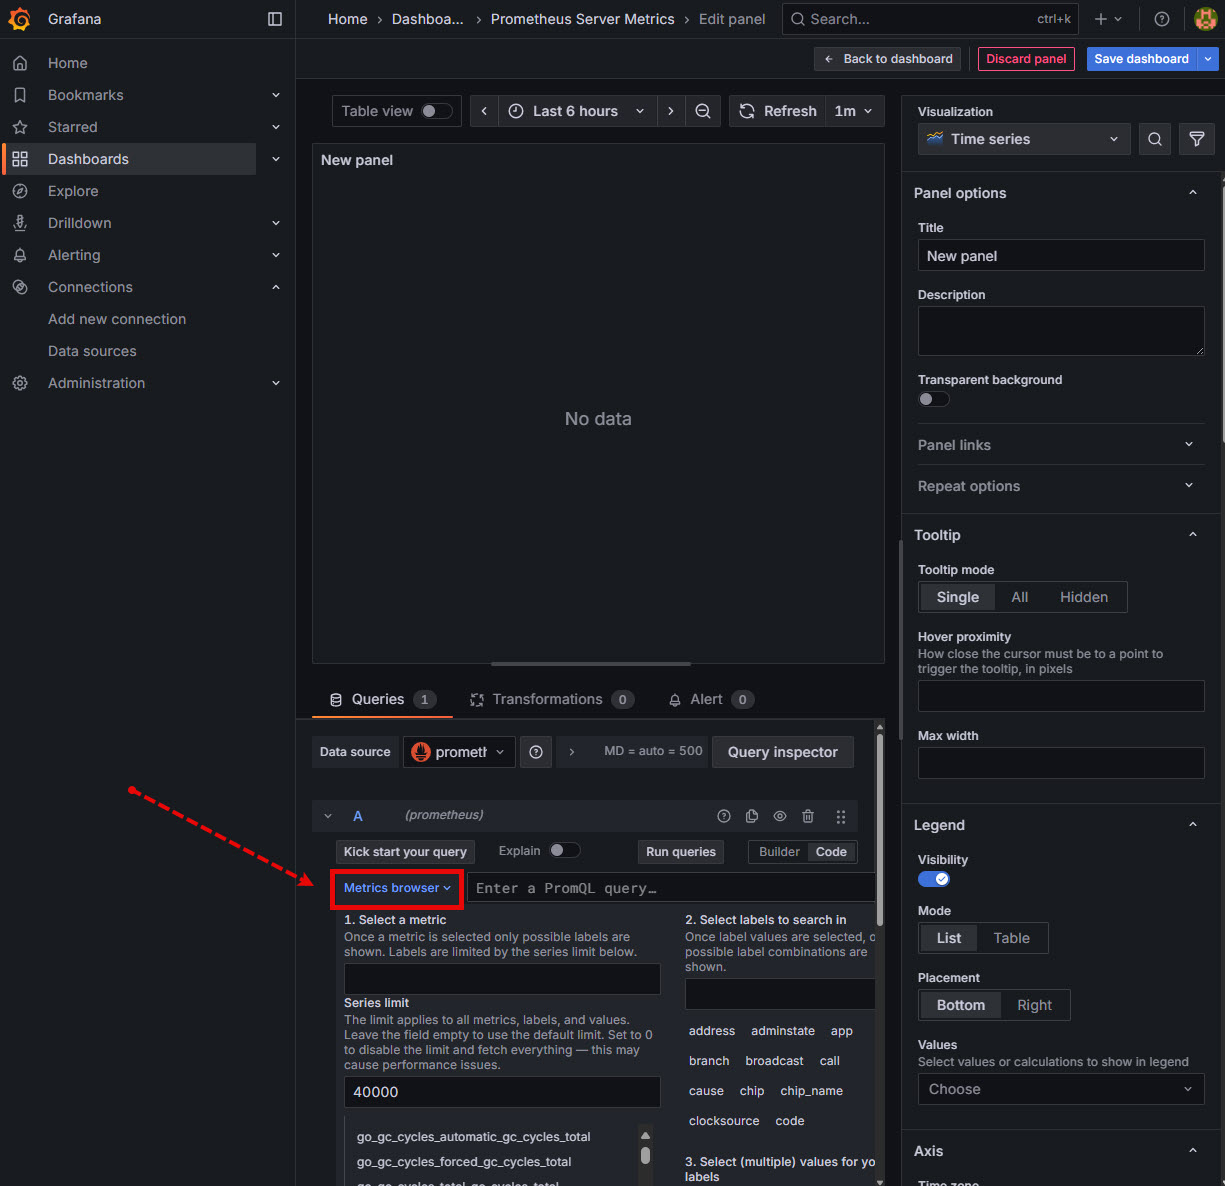
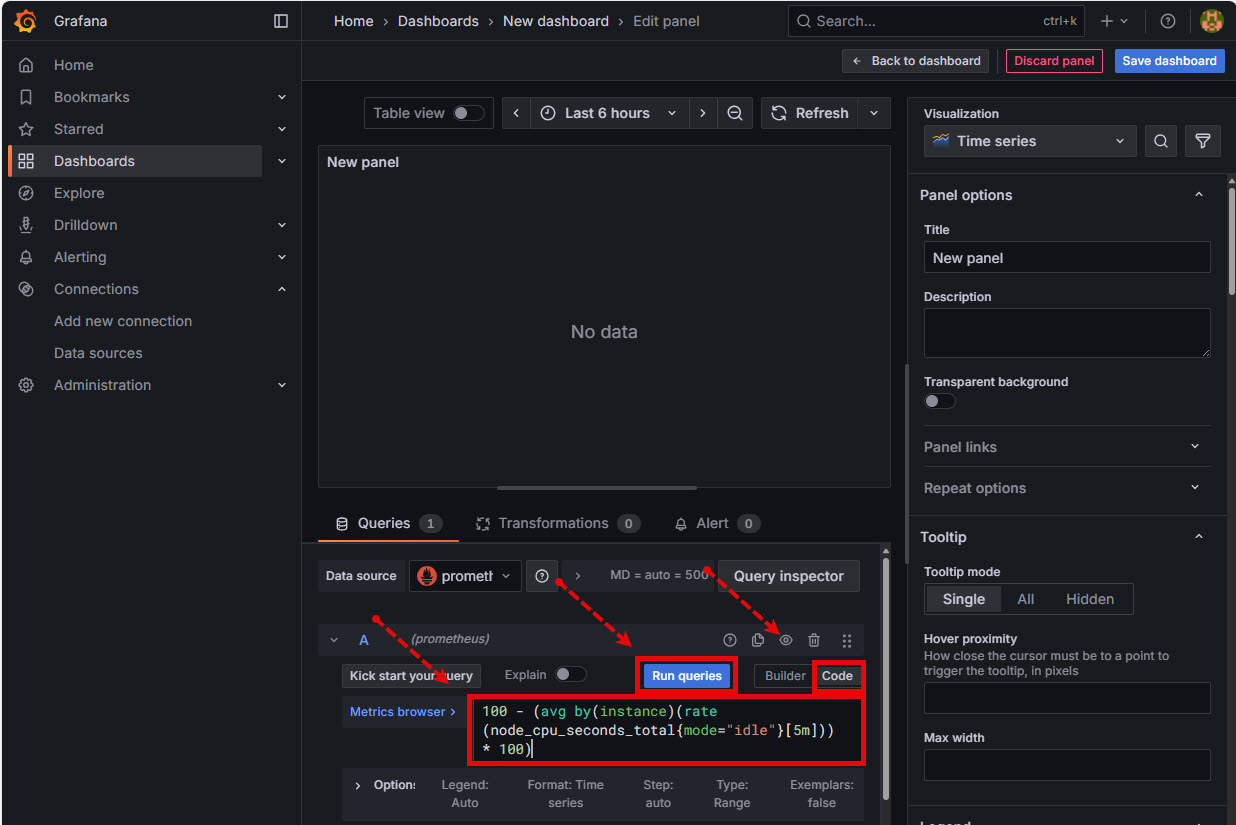
Edit Panel Page
The Edit Panel page will appear. To build a Grafana visualisation by query Click on the Code button and then add the PromQL Query into the Metrics Browser text box. Click Run Queries to complete and the visualisation will appear.
Image…
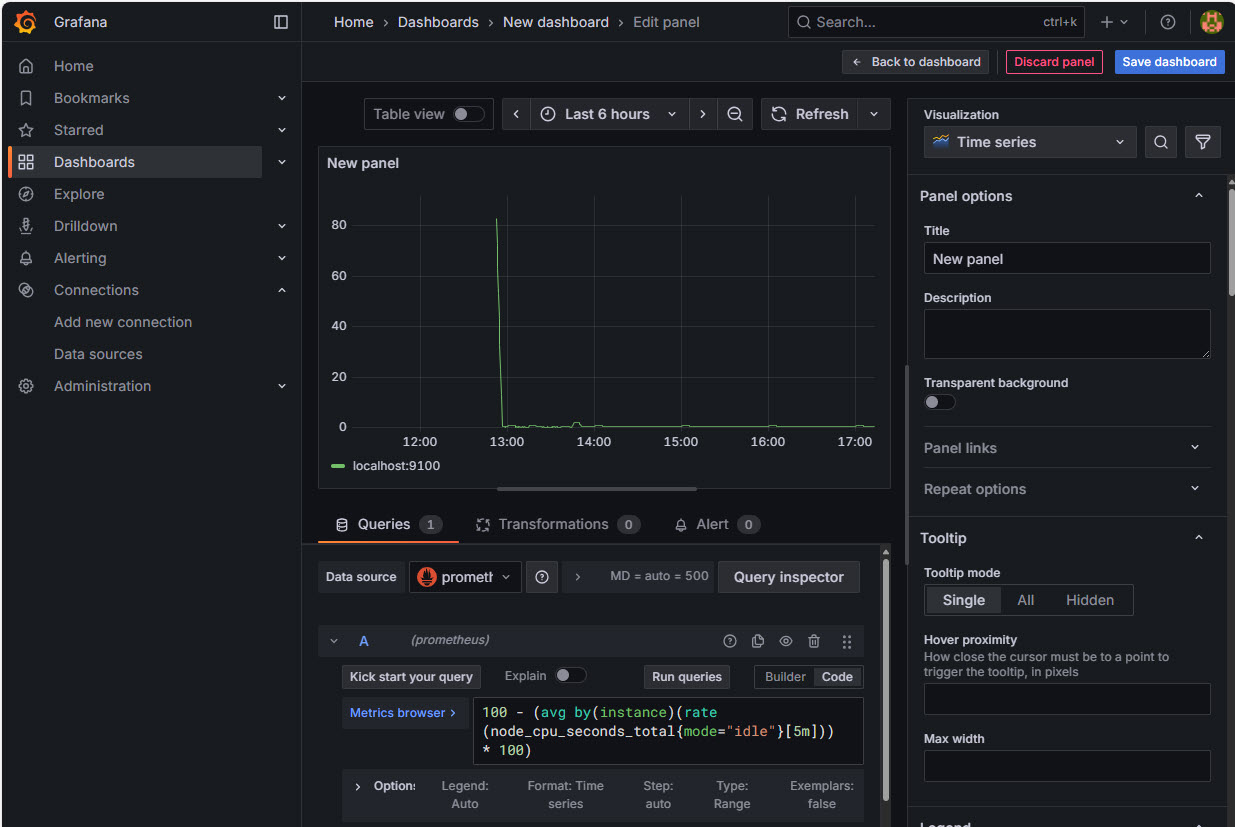
Example PromQL Queries
- CPU Usage:
100 - (avg by(instance)(rate(node_cpu_seconds_total{mode="idle"}[5m])) * 100)
- Memory Used:
-
node_memory_MemTotal_bytes - node_memory_MemAvailable_bytes
-
- Disk I/O:
rate(node_disk_written_bytes_total[1m])
- Network Throughput:
-
rate(node_network_receive_bytes_total{device="eth0"}[1m])
-
Explore Prometheus Metrics
Click on the Metrics Browser to explore available Prometheus metrics. Use mathematic equations to modify output to more readable scales.
Image…